> ## Documentation Index
> Fetch the complete documentation index at: https://docs.emadesk.com/llms.txt
> Use this file to discover all available pages before exploring further.
# Analytics
> Measure how your support performs over time.
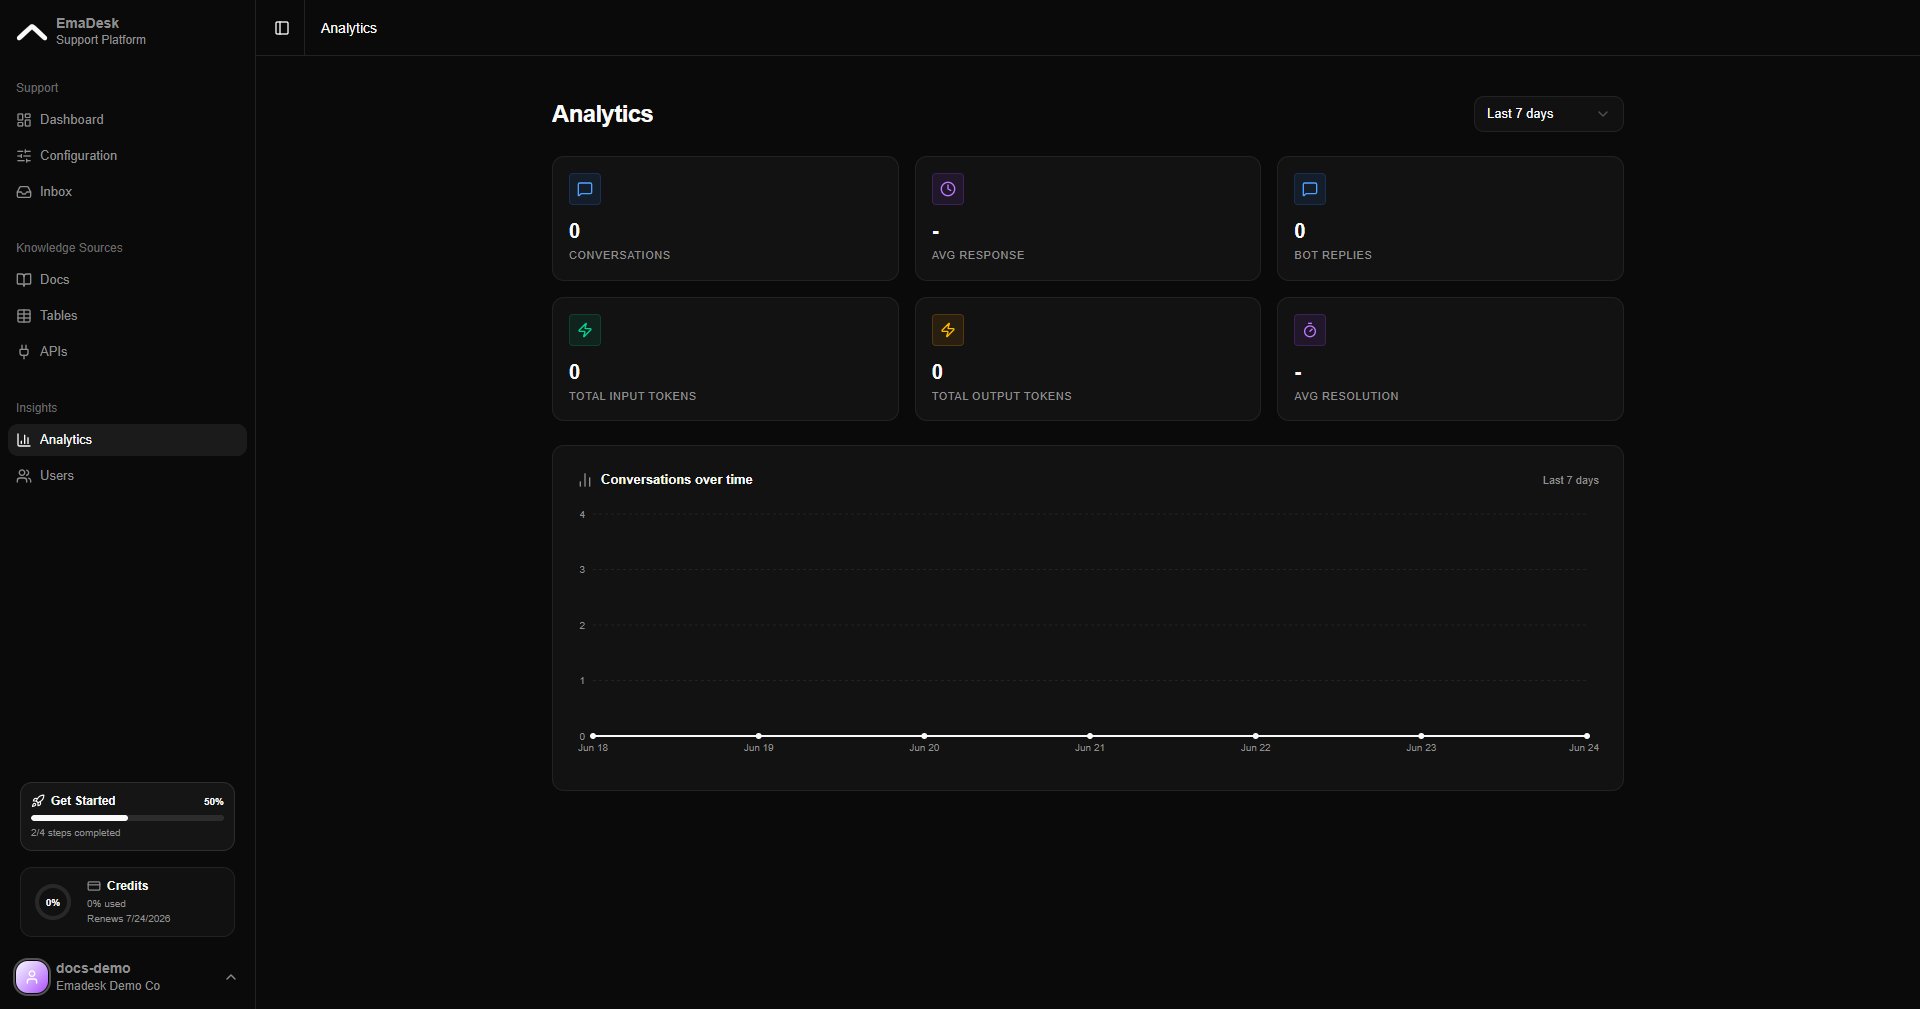
Analytics tracks how your agent is doing over the last 24 hours, 7 days, or 30 days. Switch the range to compare periods and spot trends.
 ## Key metrics
The cards at the top cover the numbers that matter:
* **Conversations** — how many chats happened in the range
* **Avg response** — the average time your agent takes to reply
* **Bot replies** — total messages your agent sent
* **Total input / output tokens** — the tokens your agent has used
* **Avg resolution** — how long conversations take to close
Below the cards, the **conversations over time** chart plots volume across the range, and a CSAT summary shows customer satisfaction.
## Sessions
The sessions list shows every conversation with its routing, tokens, latency, and satisfaction, so you can drill into individual chats.
## Key metrics
The cards at the top cover the numbers that matter:
* **Conversations** — how many chats happened in the range
* **Avg response** — the average time your agent takes to reply
* **Bot replies** — total messages your agent sent
* **Total input / output tokens** — the tokens your agent has used
* **Avg resolution** — how long conversations take to close
Below the cards, the **conversations over time** chart plots volume across the range, and a CSAT summary shows customer satisfaction.
## Sessions
The sessions list shows every conversation with its routing, tokens, latency, and satisfaction, so you can drill into individual chats.
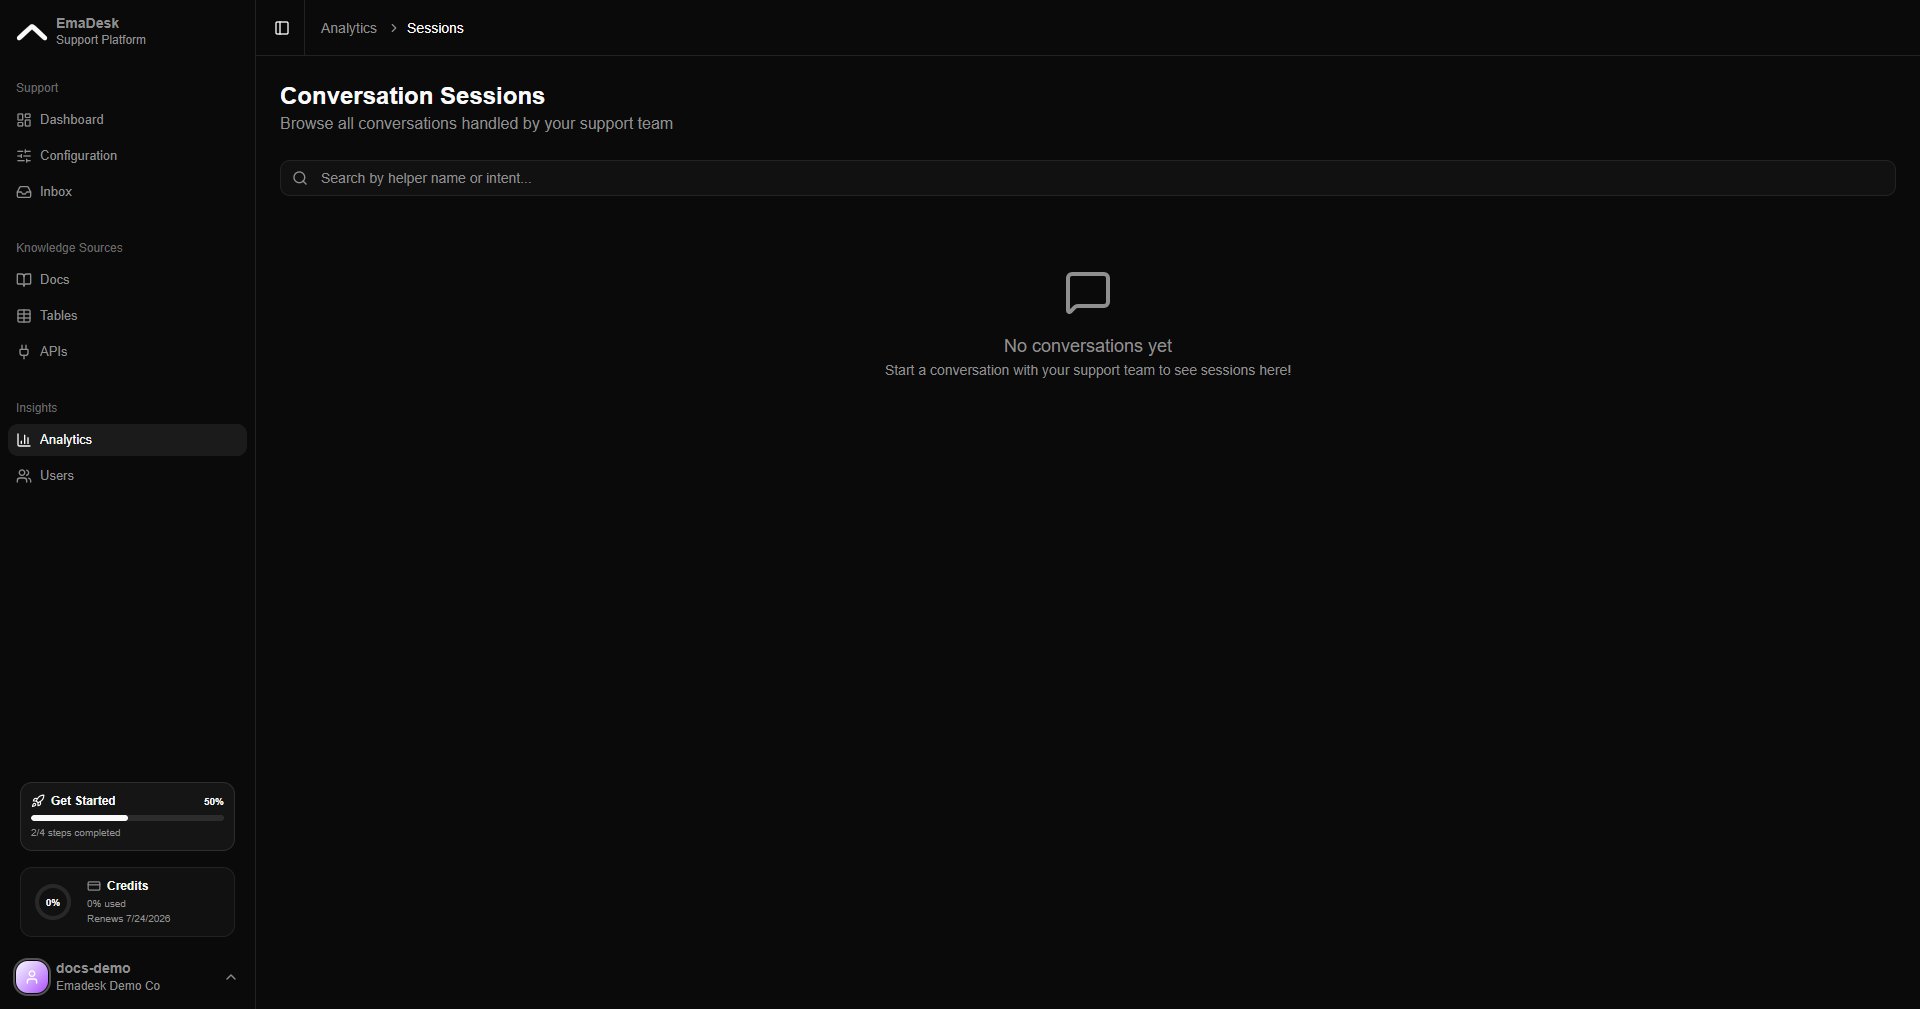 Opening a session to view its full per-message **conversation trace** is part of the advanced analytics on paid plans.